


Getting started with Error Tracking
Capture your first exception
To get started with Error Tracking, the first step is to install the PostHog SDK to start capturing exception events within your application.
Platforms
 Web
Web Next.js
 Python
 Node.js
 Ruby
Ruby React
React Angular
 Nuxt (v3.7 and above)
 SvelteKit
 Hono
Hono Android
 Flutter
- React Native
- Manual
- Nuxt (v3.6 and below)
New to error tracking? See core concepts for a primer on issues, exceptions, stack traces, and more.
Auto and manual capture
Exception autocapture can be enabled for most platforms. When enabled, PostHog automatically captures $exception events whenever errors are thrown by the client or server application.
You can also call the capture method posthog.captureException() to manually send exceptions to PostHog with custom properties.
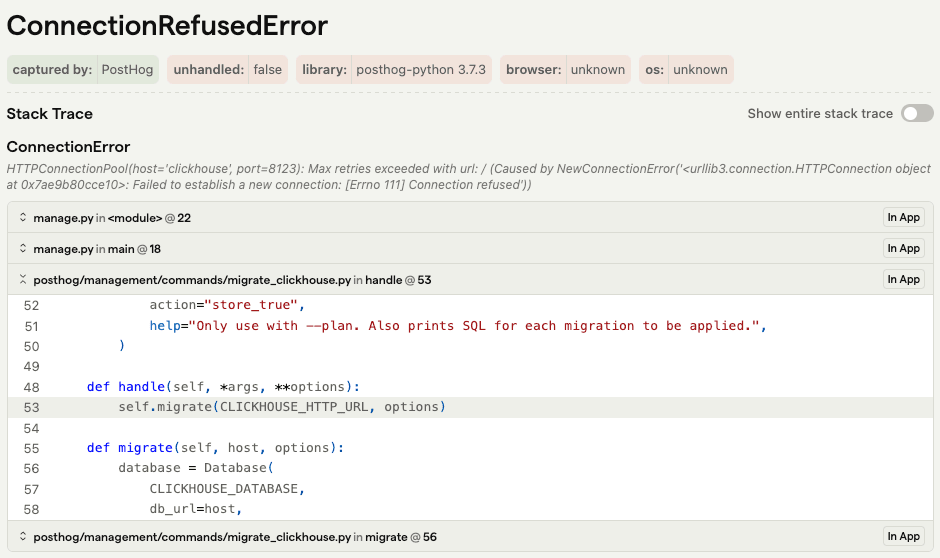
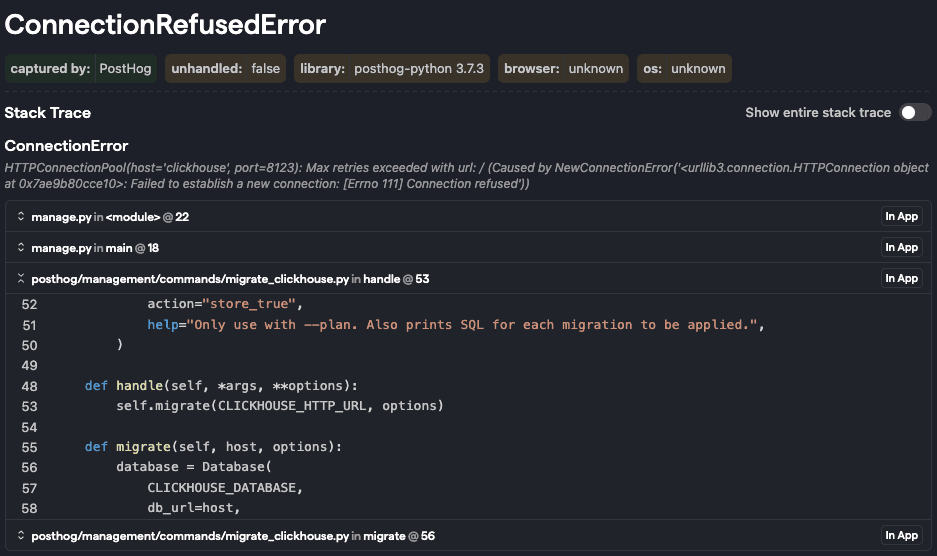
Get accurate stack traces
The second step is to upload source maps to get accurate, readable stack traces for your captured exceptions. This helps you quickly identify and debug issues by showing you the original code context where the error occurred.
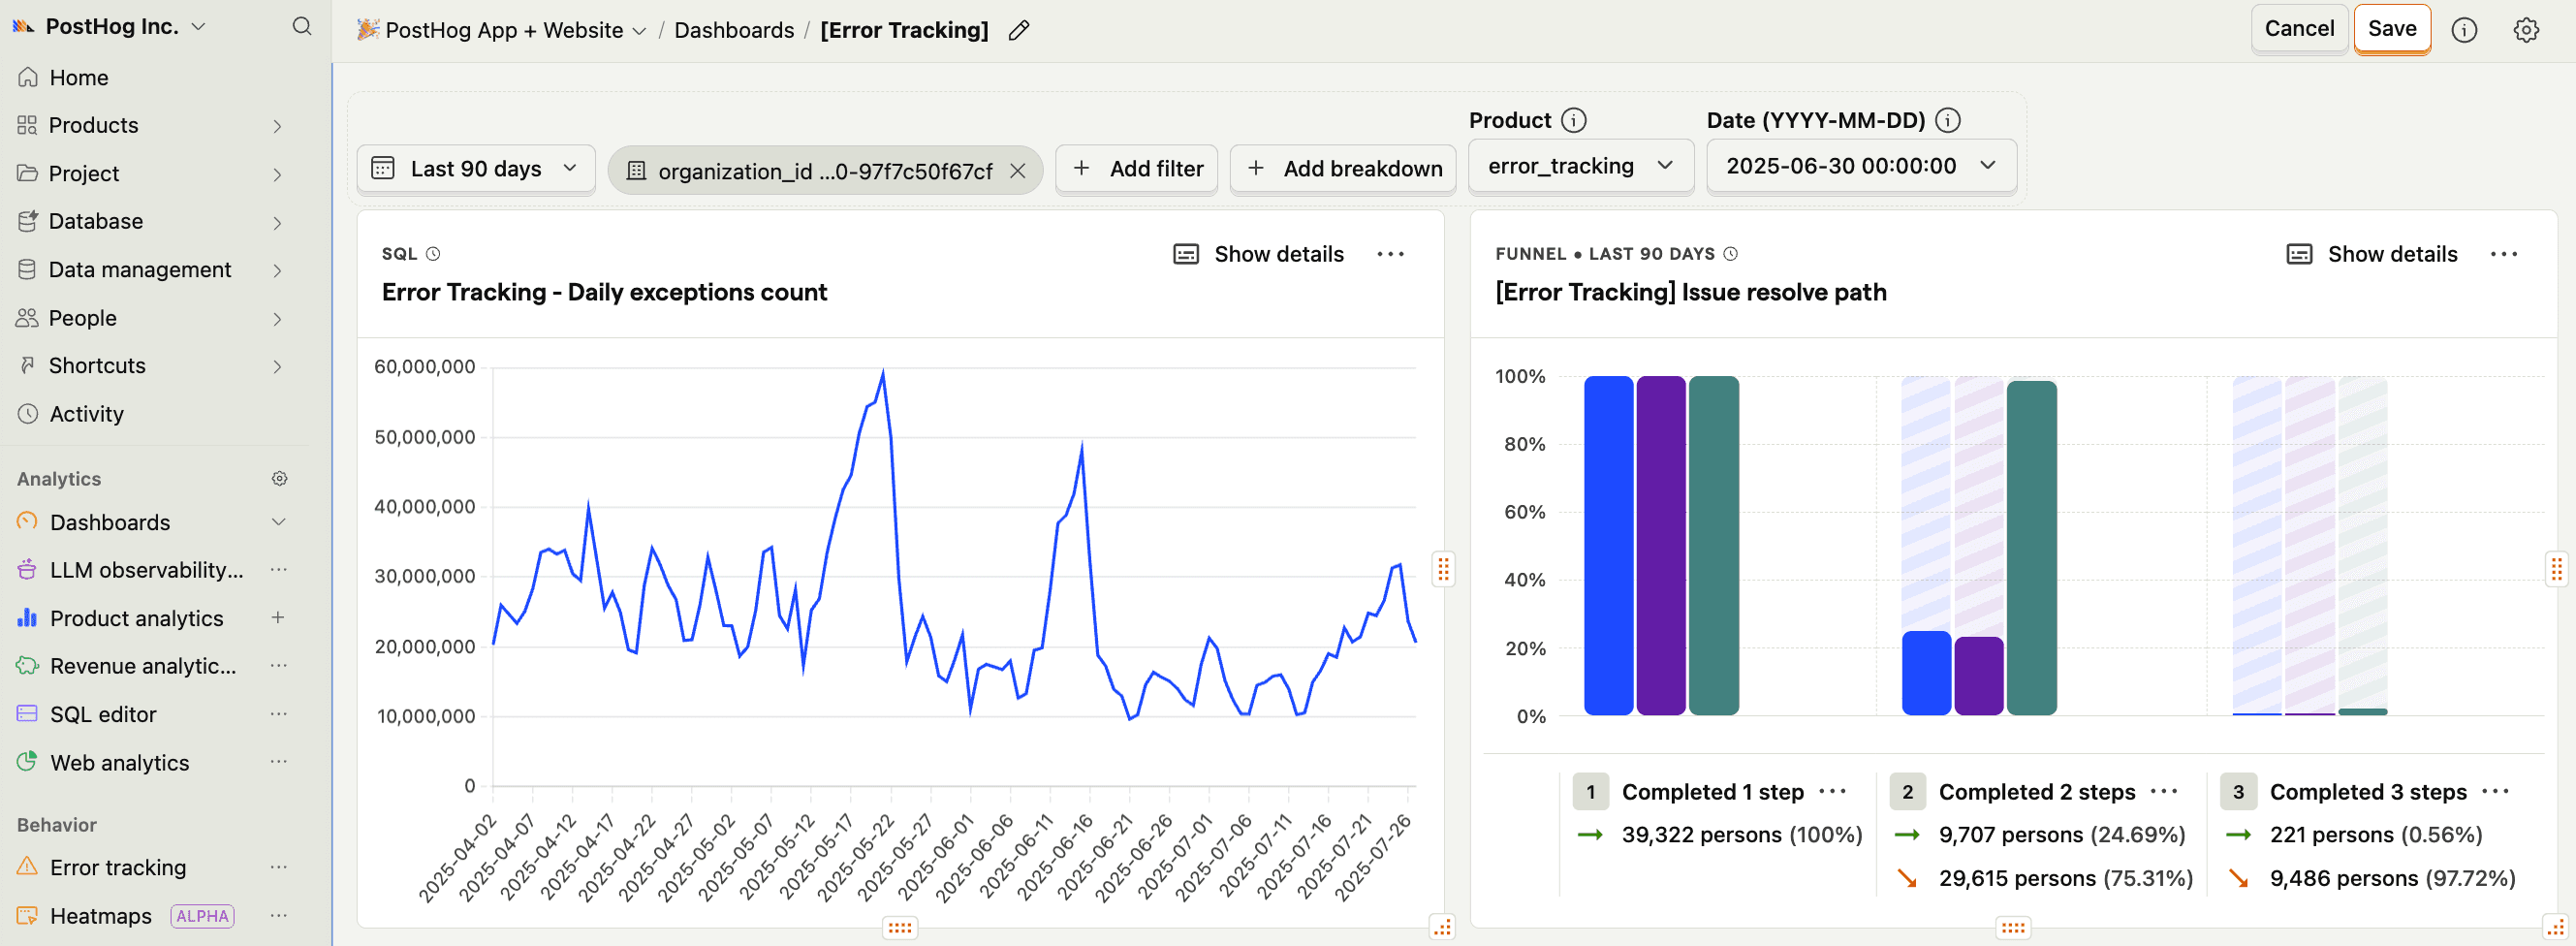
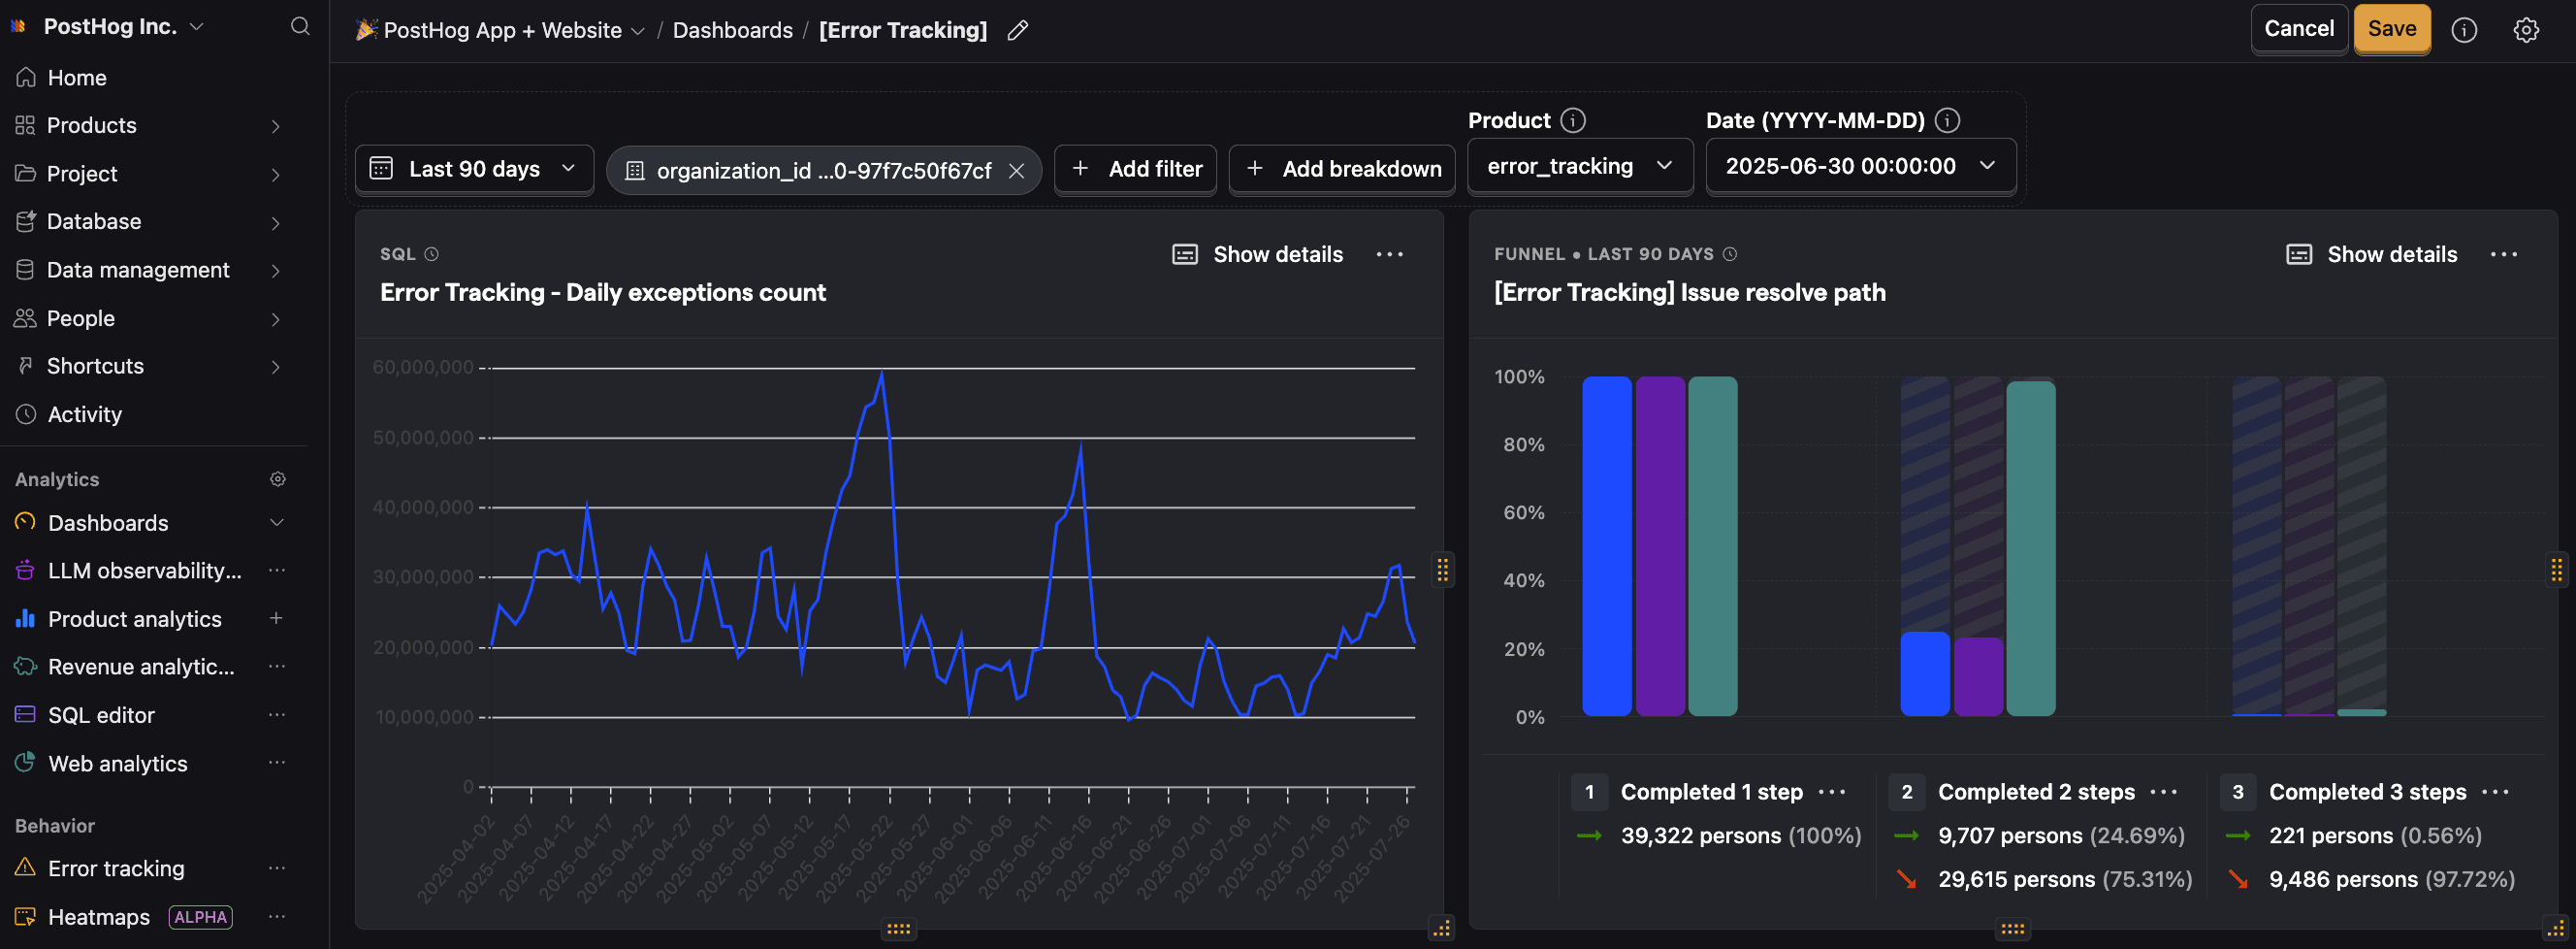
Monitor and resolve issues
Once you're capturing errors, the next step is to stay on top of issues. Exception events are grouped into issues for your team to manage based on event information, such as the exception type, message, and stack trace.
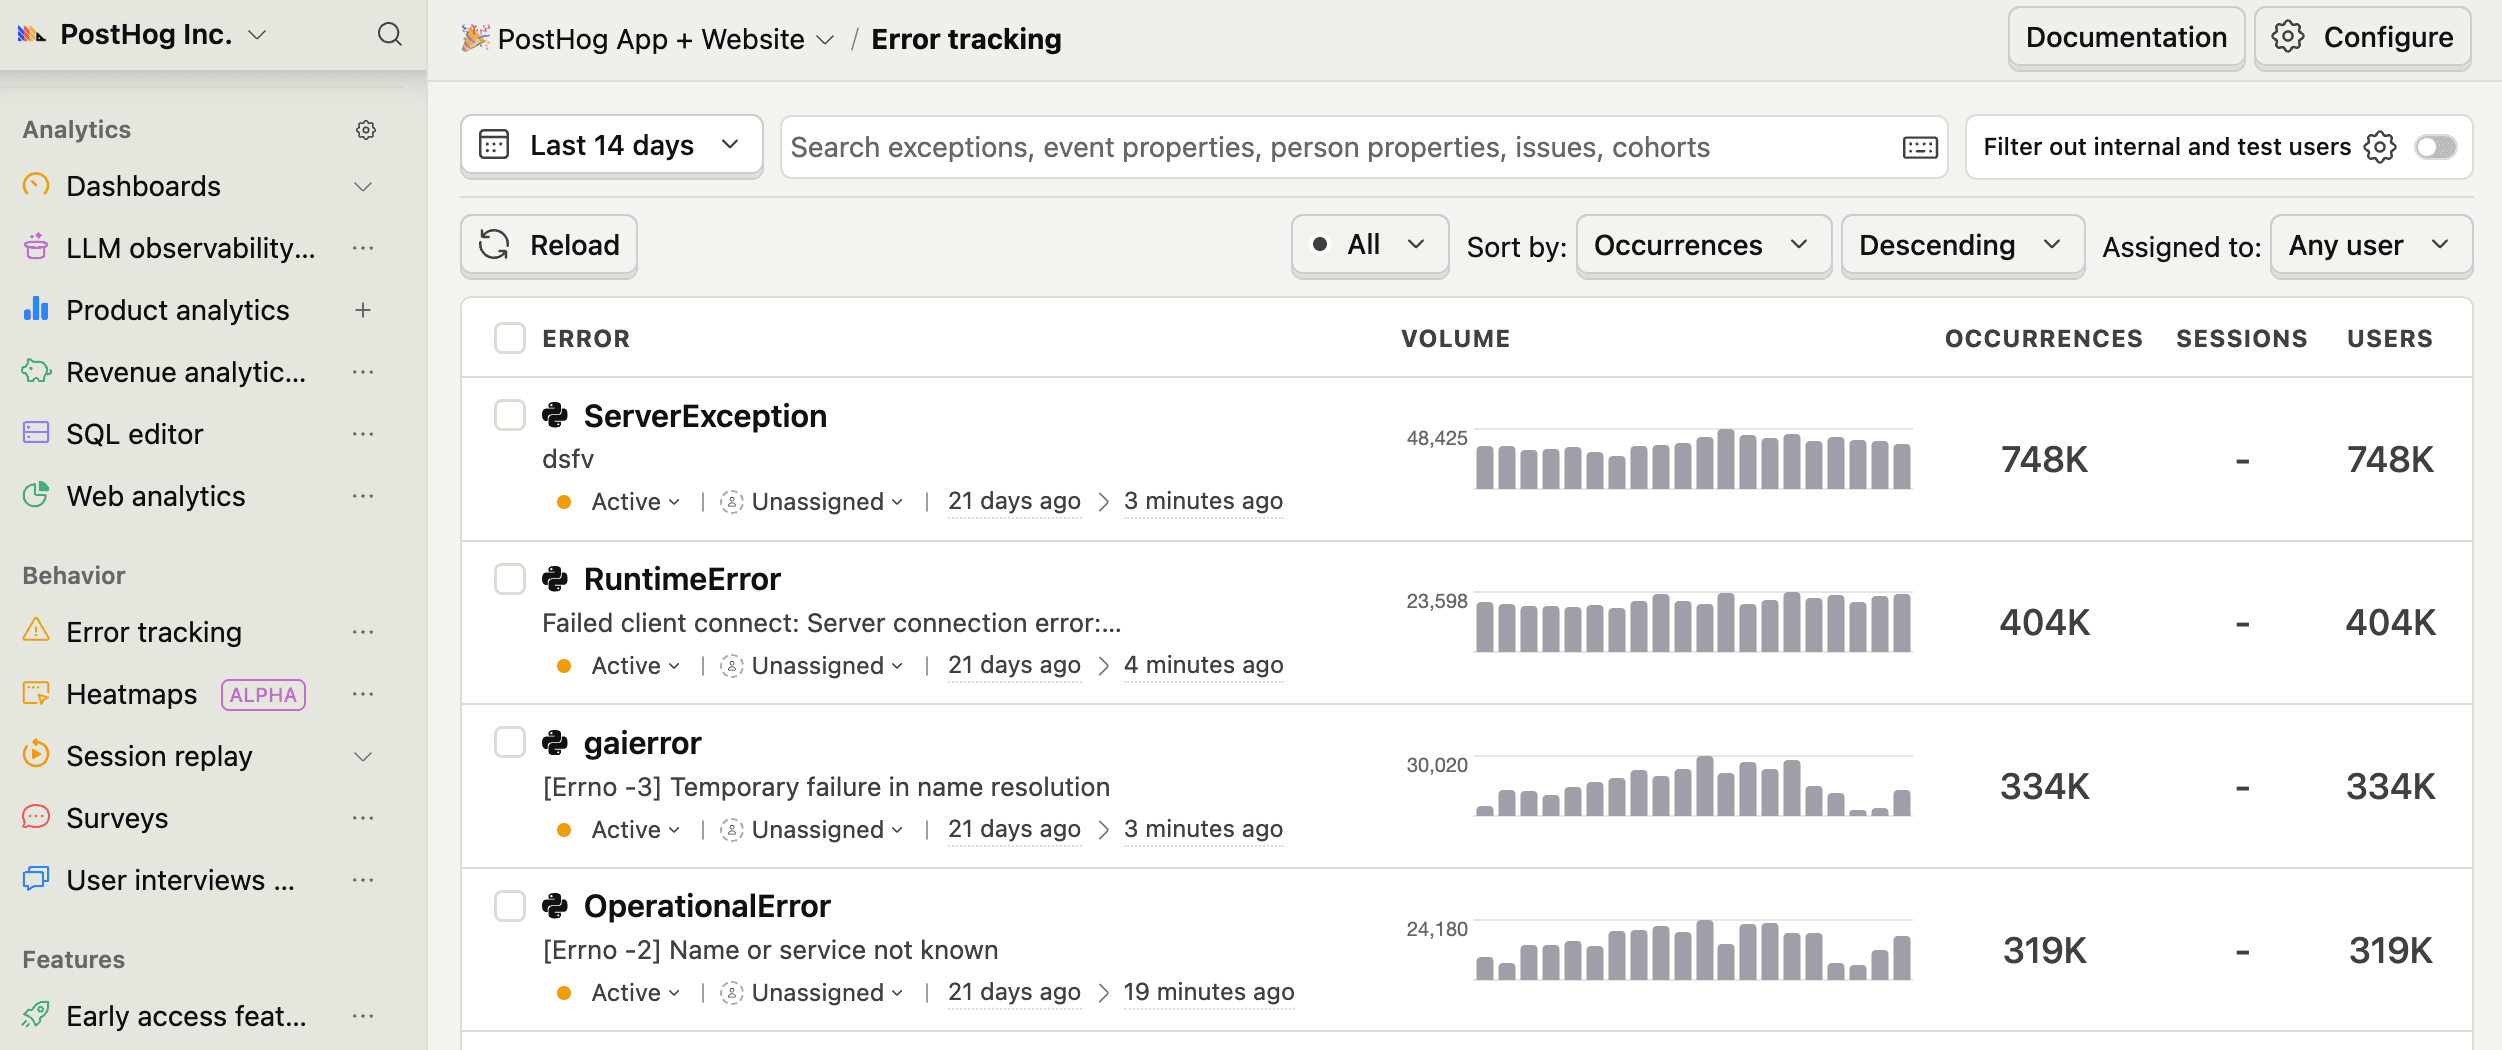
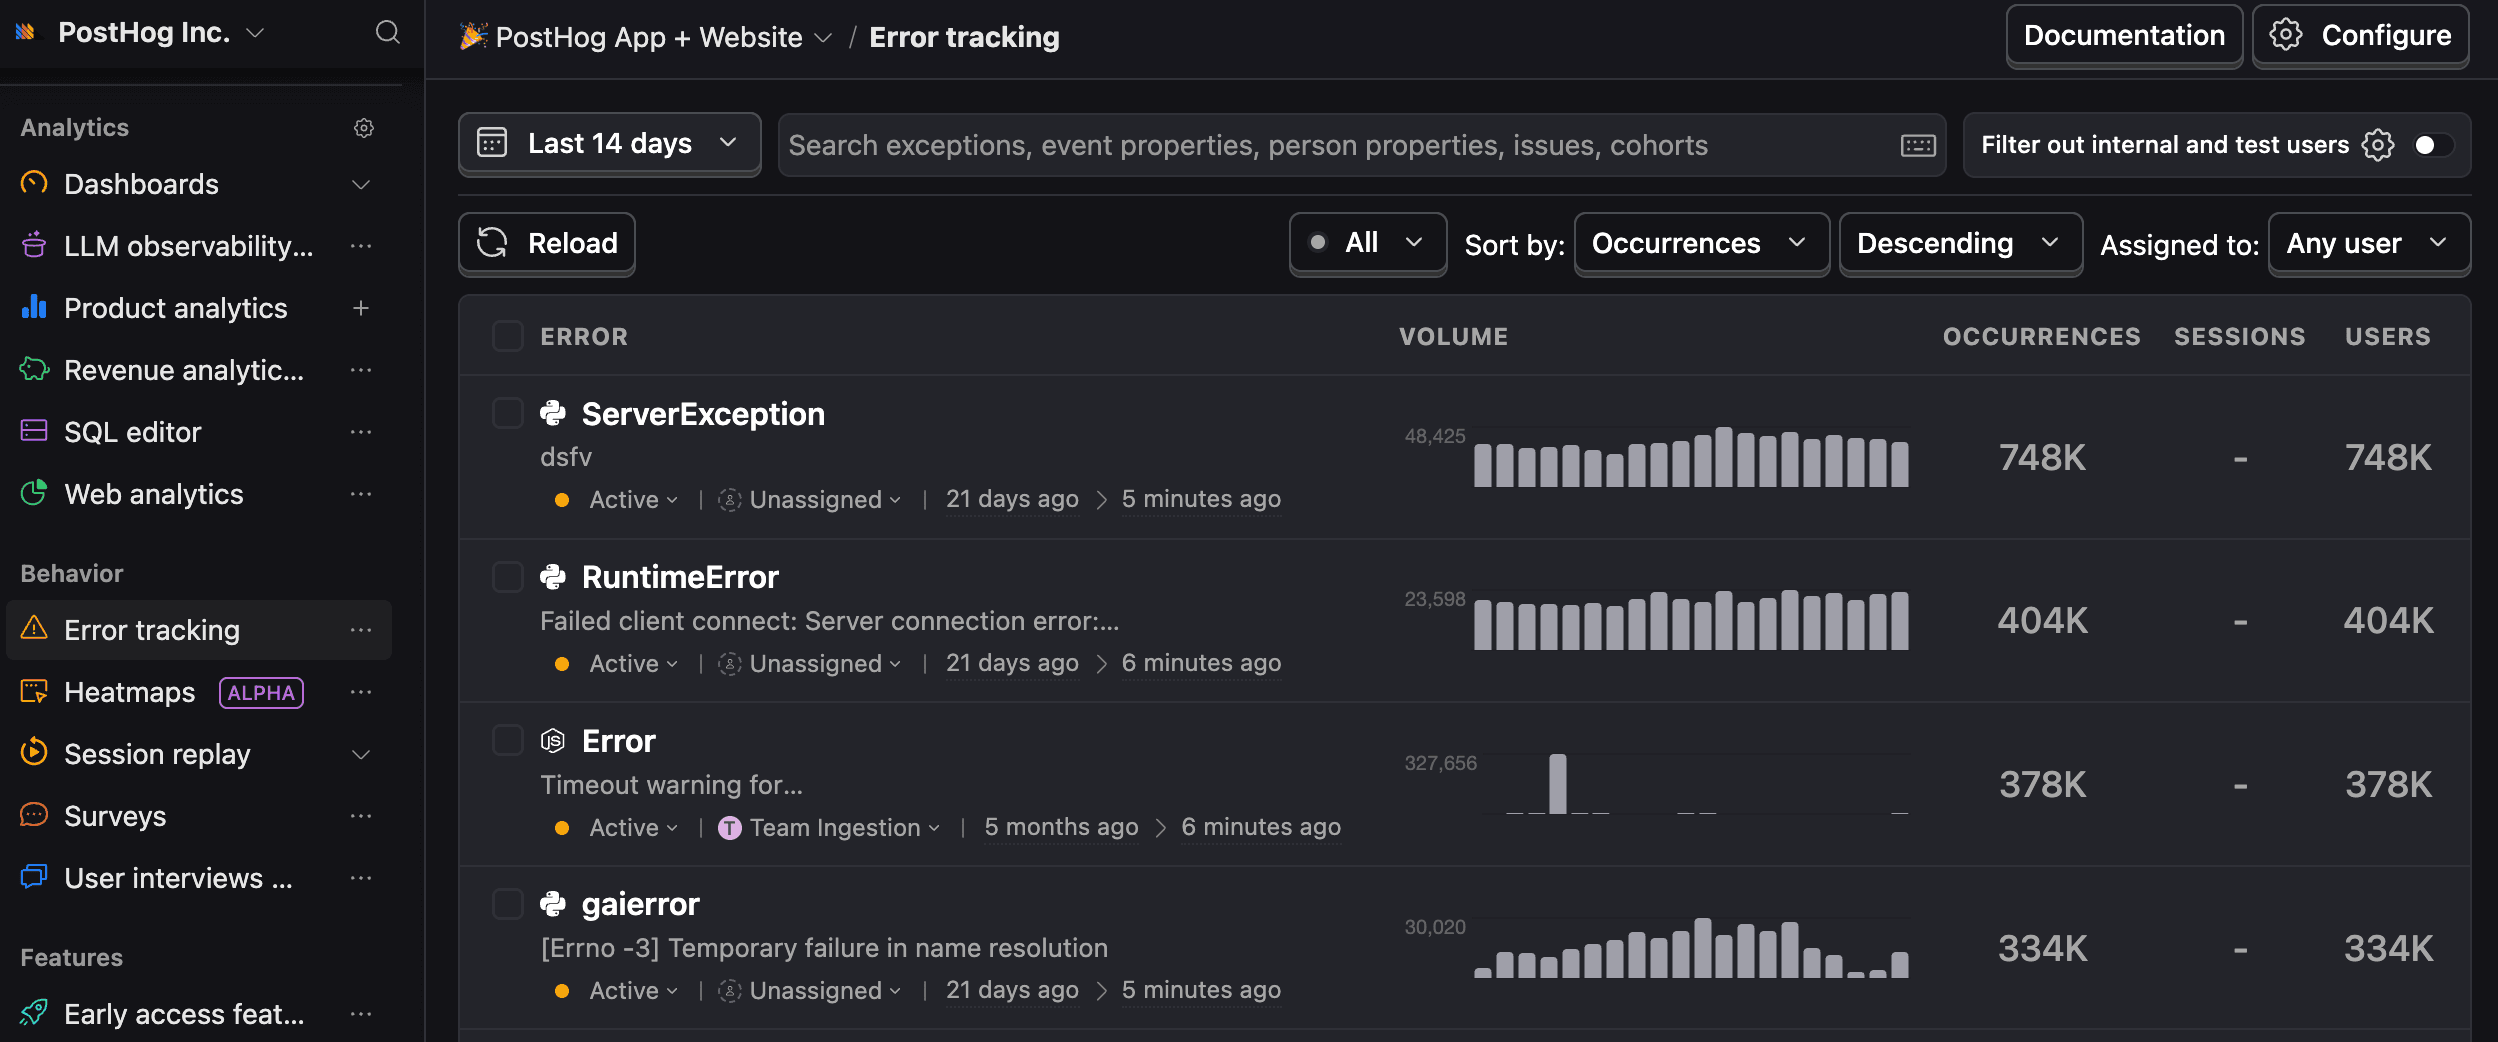
Use the PostHog Error Tracking dashboard to:
- Manage, resolve, and auto-assign issues to team members
- Customize issue grouping with rules
- Set up real-time alerts based on event triggers, filters, and trends
- Integrate with Slack, Discord, Teams, or an HTTP webhook
Debug with AI
Let AI investigate and debug errors for you.
Connect with the PostHog MCP server to enable autonomous debugging with AI agents. You can also copy our premade AI prompts which include full stack traces and curated instructions for the AI to follow.
Integrate customer data
Take advantage of PostHog's customer infrastructure features to help you move from application errors to product improvements.
Session replay
See exactly what users did before and after the error with session replays.
Product analytics
Use $exception events with product analytics to create trends, funnels, or retention insights to spot patterns and prioritize issues. You can also see exceptions by individual users in their event history log.
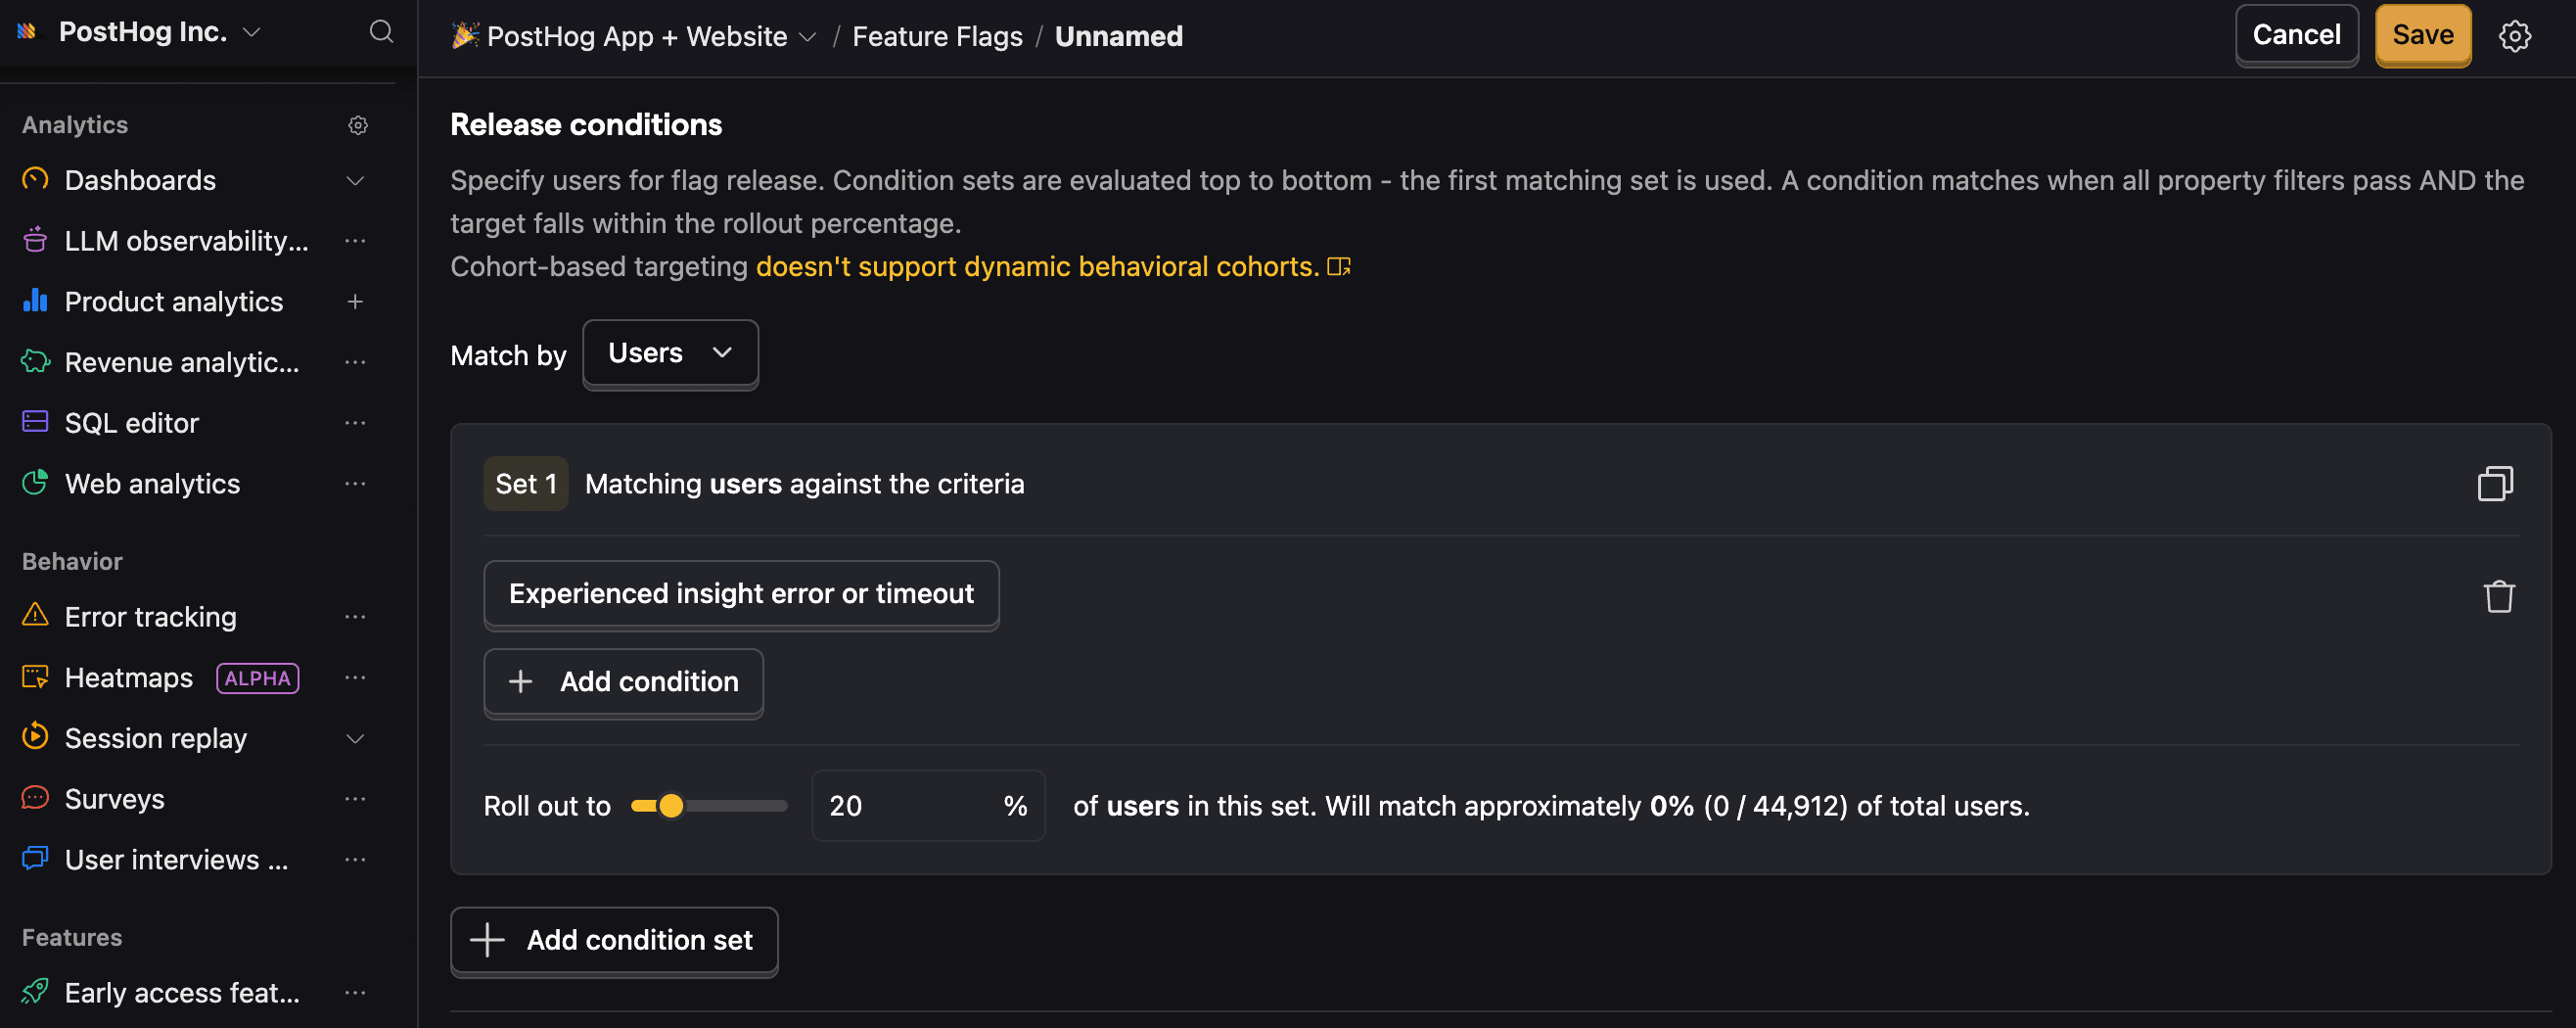
Feature flags
Roll out or revert code updates with feature flags based on users who’ve hit specific exceptions.

Use for free
PostHog's Error Tracking is built to be cost-effective by default, with a generous free tier and transparent usage-based pricing. Since we don't charge per seat, more than 90% of companies use PostHog for free.
TL;DR 💸
- No credit card required to start
- First 100K exceptions per month are free
- Above 100k we have usage-based pricing at $0.000370/exception with discounts
- Set billing limits to avoid surprise charges
- See our pricing page for more up-to-date details
And if that's still not enough, we wrote a whole page on how to cut costs.
That's it! You're ready to start integrating.